
SECTION 05 / 10
Hoeffding’s inequality
On this page 7 headings
Learning goal: Understand how sample size controls the error of a bounded average.
Conditions to check
- The displayed Hoeffding bound is one-sided.
- For a two-sided deviation, apply it to both tails and add the bounds; this introduces a factor of 2.
- The variables must be independent and bounded.
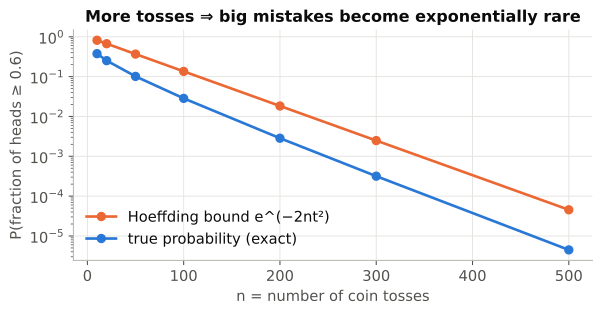
- The ideaToss a fair coin 10 times and you might easily get 7 heads (70 %).
- Toss it 1,000 times and getting 70 % heads is practically impossible.
- Averages of many independent things stick to their expected value, and the chance of straying drops exponentially fast as you add more samples.
- That is Hoeffding.
- Key statementLet be independent random variables with each .
- Let (the sample average).
- Then
Coin-toss example: .
Reading the formula piece by piece
: every observation is bounded.
For a coin with heads = 1 and tails = 0, a = 0 and b = 1.
- is your sample average, for example the fraction of heads.
is what the average "should" be.
For a coin with heads probability p, .
- t is your tolerance: how far above the truth you consider "too far".
The bound shrinks exponentially in n.
Every extra batch of samples multiplies the bound by the same small factor.
Independence is required.
"Identically distributed" is not: the can have different distributions.
Worked example 1: fair coin,
- p = 0.5.
- What is the chance that 60 % or more of 100 tosses are heads, i.e. t = 0.1?
- Exact answer (binomial): .
- The bound holds and is about 5× larger than the truth.
Worked example 2: same question,
- .
- That is about 2 in a billion; the exact value is about .
- Ten times more tosses made the bound roughly 65 million times smaller.
Worked example 3: how many samples do I need?
- You want to estimate a coin's bias to within t = 0.05, with at most a 1 % chance of overshooting.
- Solve :
- Note that this answer does not depend on p.
- This style of calculation ("how many samples?") reappears in Lesson 8 as "how many dimensions k?".
Check yourself
Fair coin, n = 50, t = 0.1. What does Hoeffding give?
.
Ratings are in [1, 5]. How does the bound change compared with a 0/1 coin?
- , so the exponent becomes .
- You need 16× more samples for the same guarantee, because the data is more spread out.
Key points to remember
- Check independence and boundedness.
- A larger sample makes a fixed-size deviation less likely.
- Use a factor of 2 for a two-sided bound.