
Chernoff bounds for projection error
On this page 11 headings
Learning goal: Derive an exponential upper bound on projection failure.
Conditions and notation
- The normalized coordinates are independent standard normal variables.
- Choose λ after the Taylor bound.
- The resulting one-sided bound is .
- The ideaAdd up k squared bell-curve numbers.
- The total averages k.
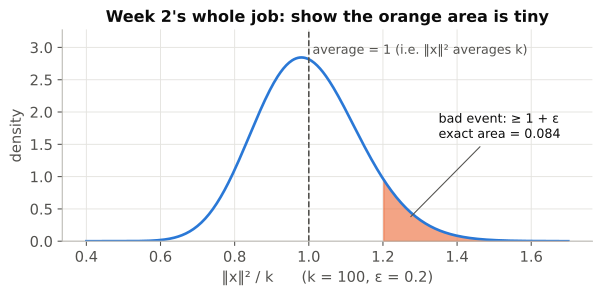
- We want to show that being 20 % or more above average is extremely rare, and that it gets rarer exponentially fast as k grows.
- Markov and Chebyshev are too weak for this.
- The trick: before using Markov, blow the quantity up with an exponential.
- This exaggerates big values so much that Markov suddenly gives a sharp answer.
Step 0: recall the projection setup
- Key statementn points S in are mapped by to ; we want for all x, y ∈ S.
- For one vector u: , , , .
Key statement
means are independent numbers.
For Gaussians, zero correlation (identity covariance) implies independence.
- So ‖x‖² averages k, and the bad event asks for a value at least times its average.
Whether this is rare depends on how tightly ‖x‖² concentrates around k.
That is a concentration-inequality question.
Step 1: why Markov and Chebyshev are not enough
- Both inequalities apply: the squared norm is non-negative and has finite variance.
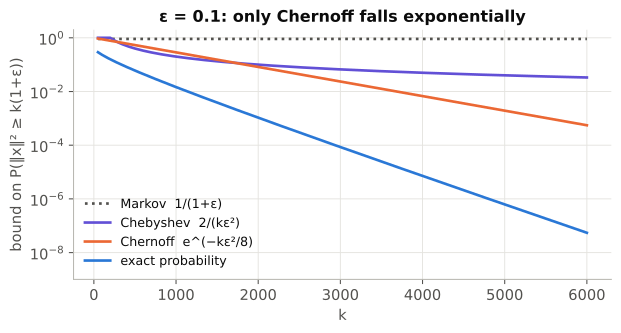
- Compare the bounds they give:
Markov: .
For ε = 0.1 that's 0.91, for every k.
It never improves, so it's useless.
Chebyshev: , so .
The bad event is a deviation of εk, so .
That improves, but only like 1/k.
Worked example: why 1/k is fatal
- In Lesson 2 we must survive about pairs at once, so we need roughly .
- With Chebyshev: .
- For n = 1,000, ε = 0.1, δ = 0.01 that is , far more than the original d.
- We need a bound that falls exponentially in k, so that gets cancelled by a mere log.
Step 2: exponentiate, then use Markov
Chernoff-style boundFor any λ > 0:
- The equality: is increasing for λ > 0, so the two events are the same event (Toolkit 0.2).
- The inequality: Markov's inequality, , applied to the non-negative random variable with .
Why bother? The exponential makes big values of ‖x‖² count enormously, so Markov's single number "feels" the whole tail.
And the exponential turns the sum into a product of independent pieces, which we can compute exactly.
Step 3: split into independent pieces
Key statement
- : the sum in the exponent becomes a product.
- The are independent, so the expectation of the product is the product of expectations (Toolkit 0.3).
- Each factor is the Gaussian MGF fact (Toolkit 0.4).
- The same factor appears k times, giving the power k/2.
Step 4: simplify and choose the best λ
Key statement
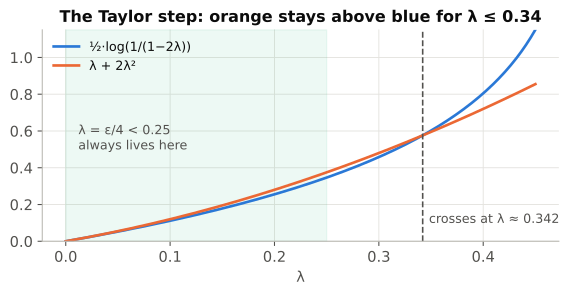
(Taylor series of log, small enough λ)
Rewrite as one exponential: , and bring the denominator up as a minus sign in the exponent.
Then pull out k.
Taylor step: for small λ (valid up to λ ≈ 0.342, Toolkit 0.5).
The two λ terms cancel, leaving a simple parabola.
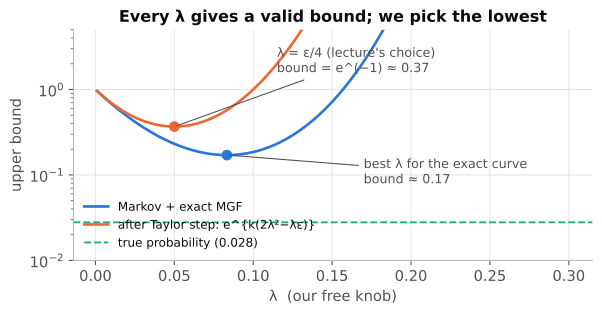
Choose λ: every allowed λ gives a valid upper bound, so we pick the one that makes the bound smallest.
The parabola's bottom is at λ = ε/4 (Toolkit 0.6).
Worked example: the whole chain with numbers
k = 200, ε = 0.2.
- Bad event: , while the average is 200.
λ = ε/4 = 0.05.
MGF factor: ; to the power 200: .
- Denominator: .
- Markov + exact MGF: .
- After the Taylor step: , which equals . ✓
True probability (computed exactly from the chi-square distribution): 0.028.
The bound holds.
Worked example: watch it fall exponentially
- ε = 0.1, so the bound is : k = 1,000 gives 0.29; k = 2,000 gives 0.082; k = 5,000 gives 0.0019; k = 10,000 gives .
- Each extra 1,000 dimensions multiplies the bound by the same factor .
Check yourself
Why can we apply Markov to ?
It's never negative (an exponential is always positive), which is all Markov needs.
Where exactly is independence used?
To turn into .
Evaluate the bound for k = 400, ε = 0.2.
.
If ε halves, how must k change to keep the same bound?
The exponent is kε²/8, so k must become 4×.
Key points to remember
- The normalized coordinates are independent standard normal variables.
- Choose λ after the Taylor bound.
- The resulting one-sided bound is .